
Small Business Pulse Survey Updated October 6th, 2022
In April of 2020, the U.S. Census Bureau launched the Small Business Pulse Survey (SBPS) to produce crucial data in near real-time on the challenges small business were facing due to the Coronavirus pandemic. After two years of data collection, the SBPS is closed. The Census Bureau incorporated lessons learned and stakeholder feedback from SBPS to continue near real time data with the Business Trends and Outlook Survey.
To mark the closing of the SBPS chapter, a series of charts were created that highlight the three indexes that span the entirety of the survey. These indexes offer a numeric representation of one or more questions and provide a view into how small businesses weathered the past two years.
Figure 1. Overall Effect of the Pandemic on Businesses
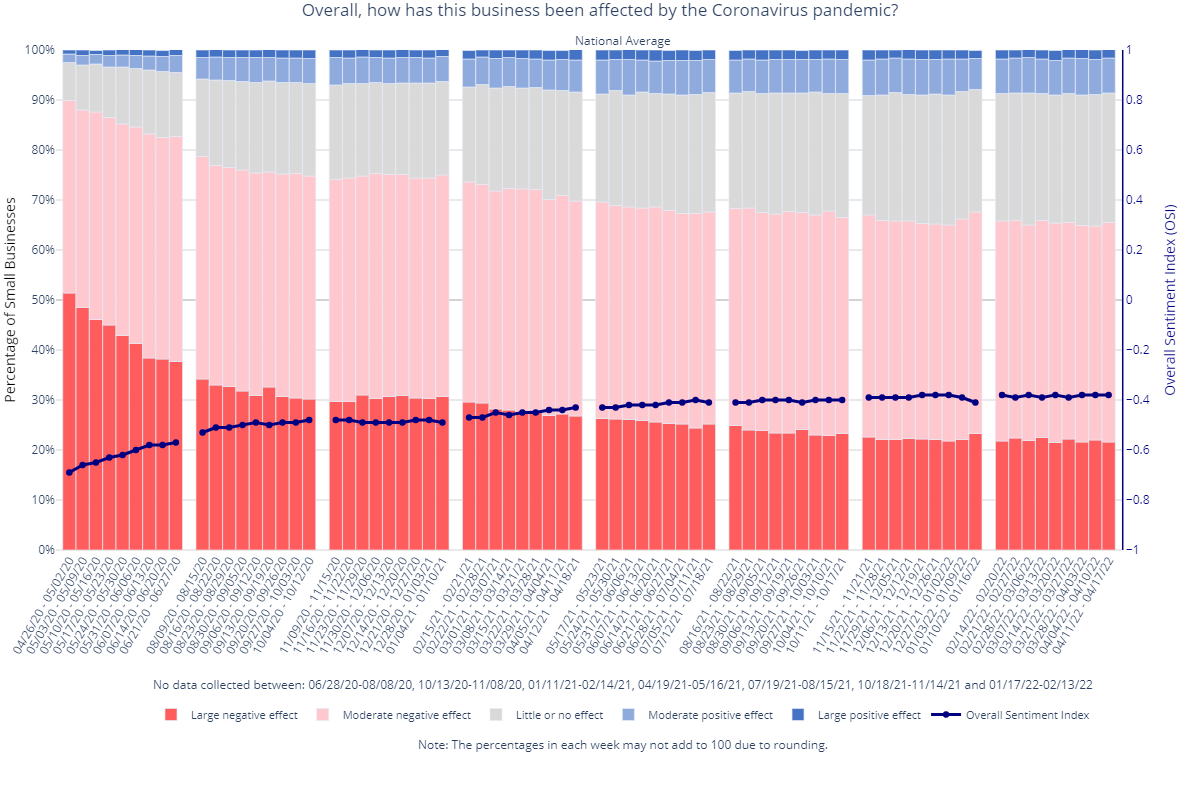
The Overall Sentiment Index summarizes the responses to the Overall Effect question to provide a numeric representation of the survey topic. Negative values (up to -1) of the index indicate a negative effect (increasingly so as the index value approaches -1), zero indicates little or no effect, and positive values (up to +1) indicate a positive effect (increasingly so as the index value approaches +1). In Figure 1, this index has been plotted as a line over the Overall Effect survey responses using a secondary y-axis to the right of the chart.
Figure 2. Overall Sentiment Index by Sector
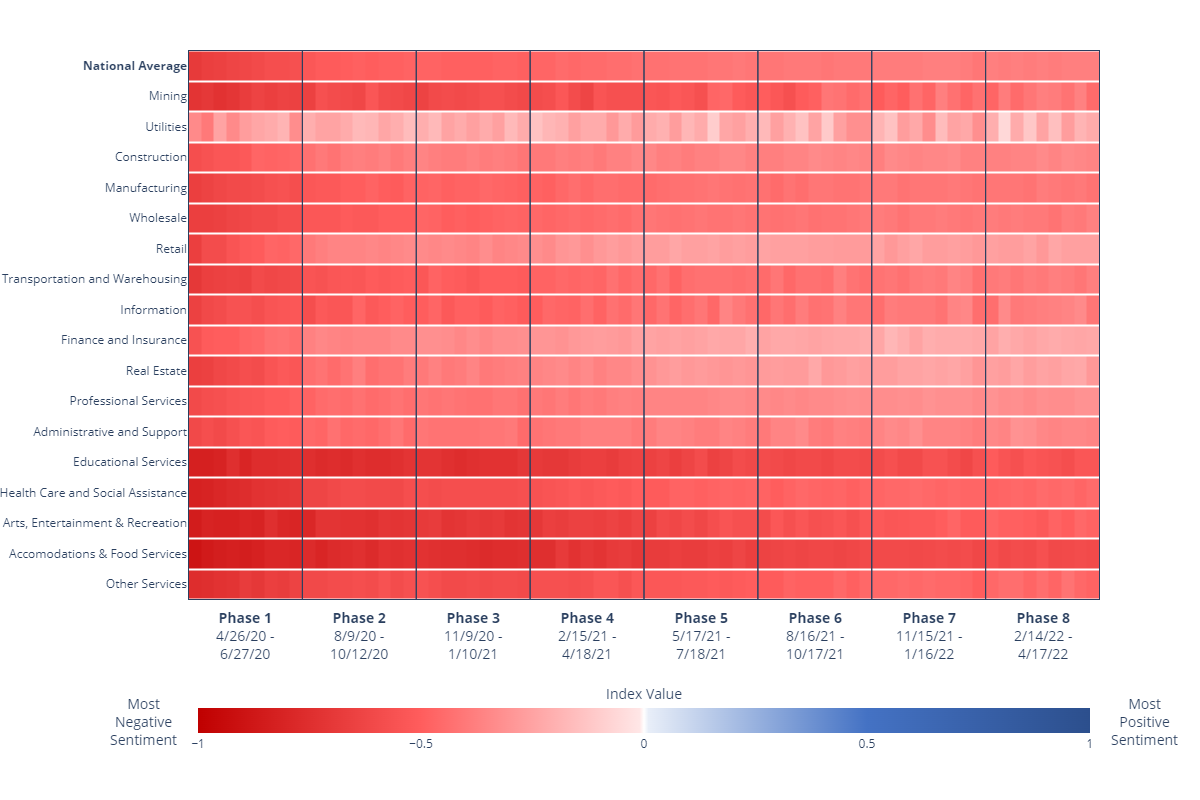
Figure 3. Share of Businesses with Changes in Revenue, Employment, Hours
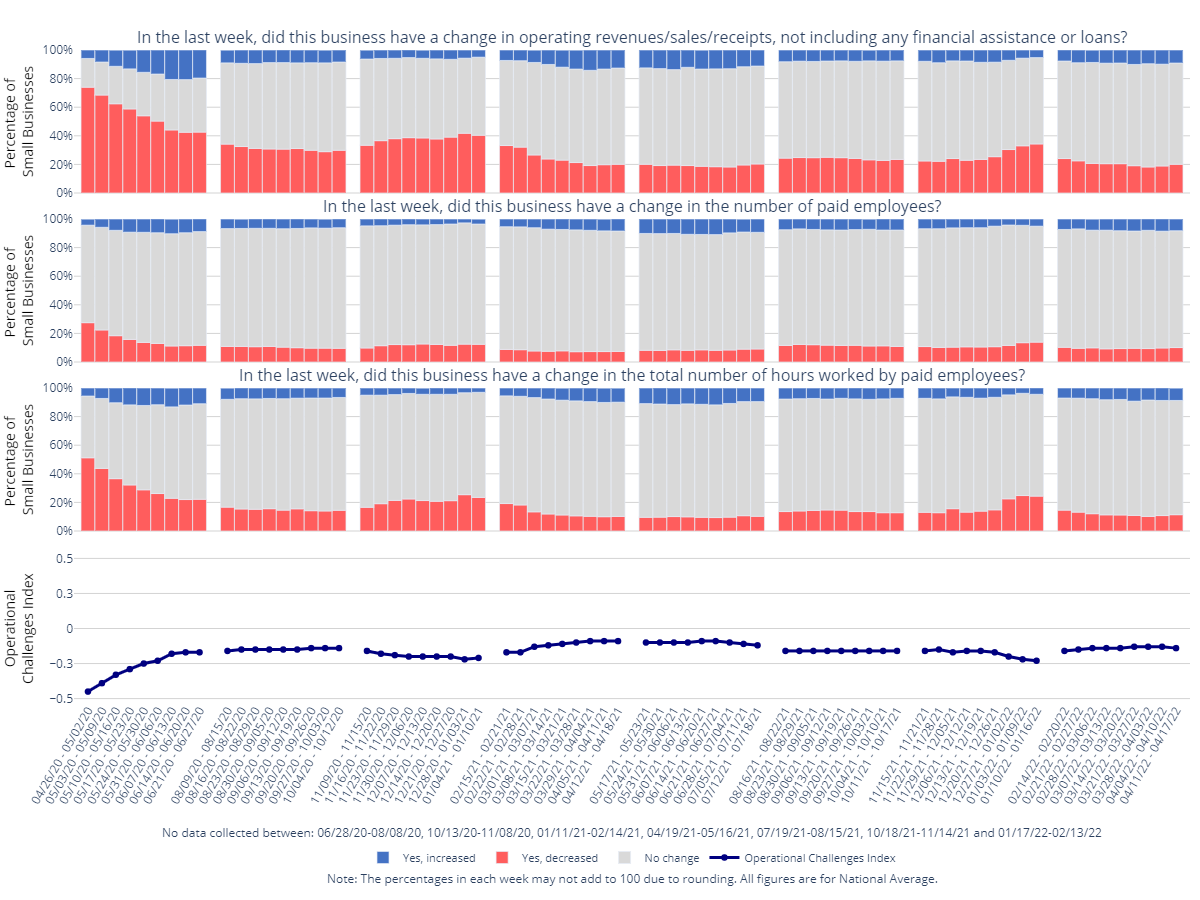
The Operational Challenges Index summarizes, among others, survey responses to changes in revenue, employment and hours worked questions to provide a numeric representation of the average effect of the pandemic on business operations. Negative values (up to -1) of the index indicate a negative effect on operations (increasingly so as the index value approaches -1), zero indicates little or no effect, and positive values (up to +1) indicate a positive effect (increasingly so as the index value approaches +1).
Figure 4. Operational Challenges Index by Sector
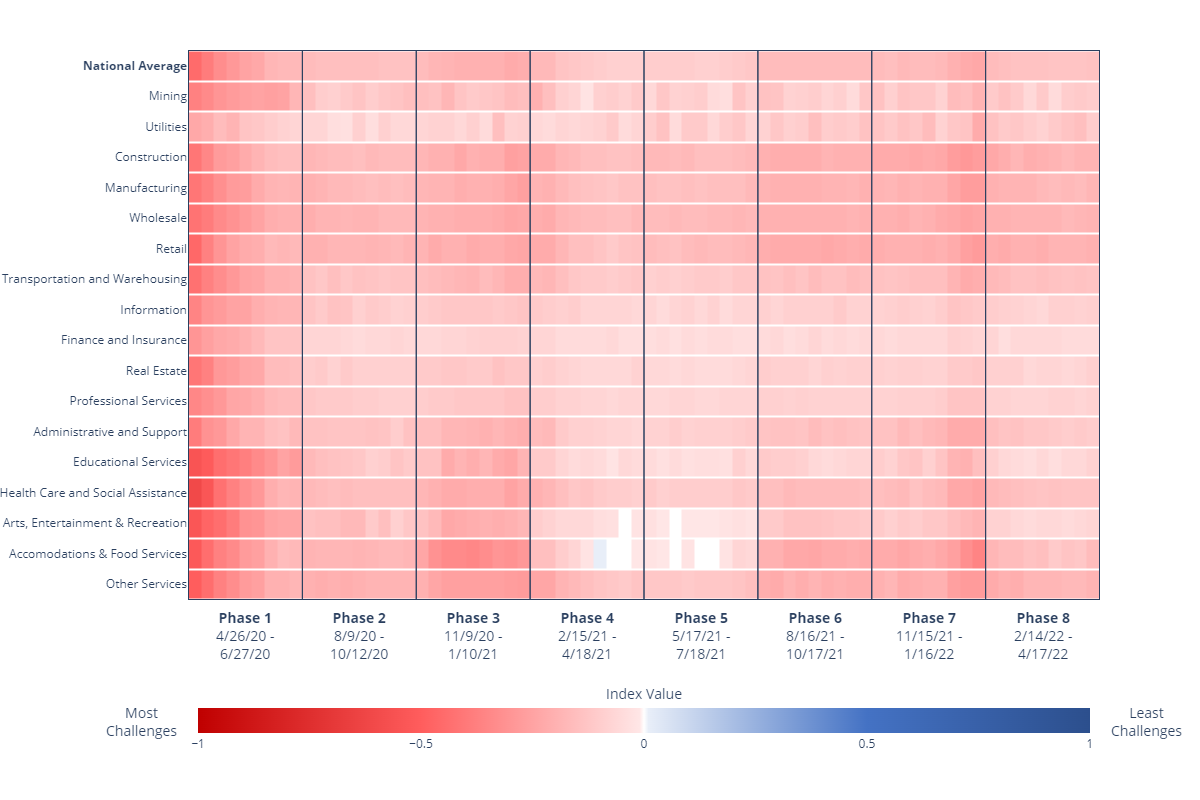
Figure 5. Expectations of Recovery
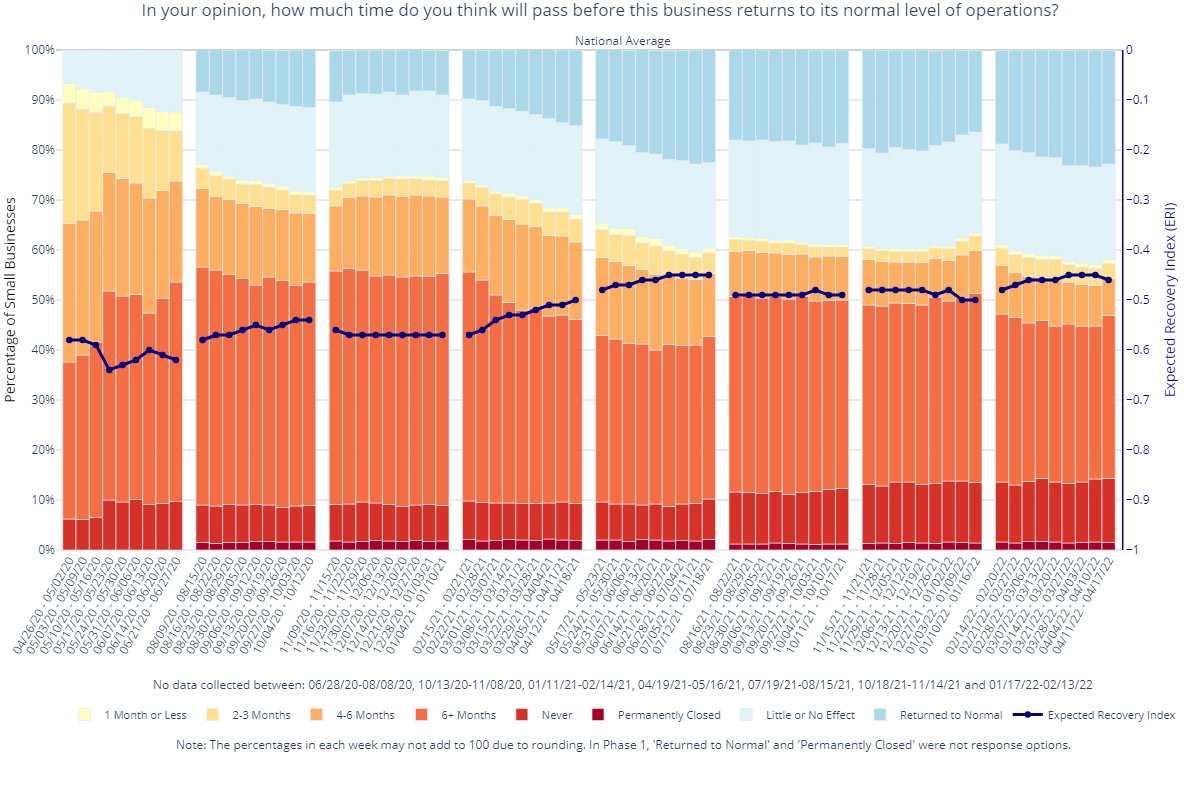
The Expected Recovery Index summarizes responses to the Future Expectations question to provide a numeric measure of the average expected recovery time of businesses. Negative values (up to -1) of the index indicate that the business needs time to recover (and an increasing recovery period as the index value approaches -1), while zero indicates little or no effect (no recovery period). In Figure 5, this index has been plotted as a line over the Future Expectations survey responses using a secondary y-axis to the right of the chart.
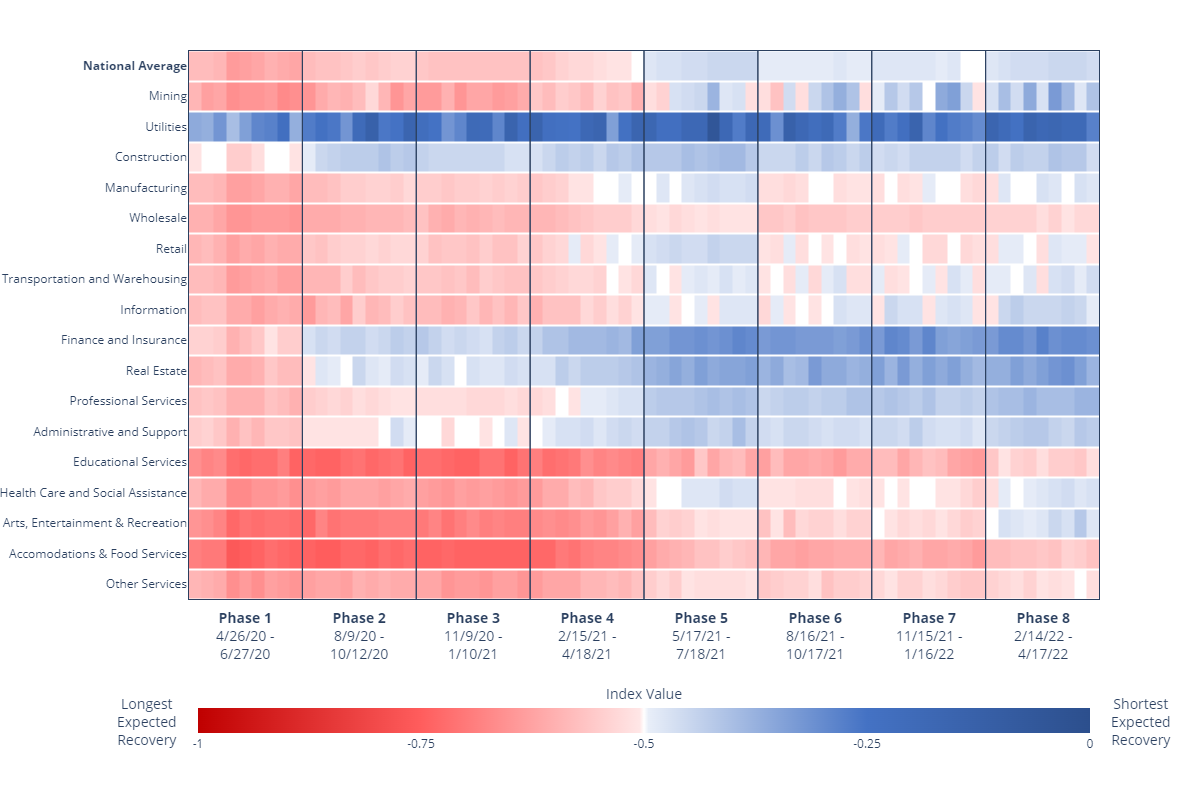
Figure 6. Expected Recovery Index by Sector
For more SBPS data and for information on how the indexes were constructed, visit the Data, Weekly Comparisons, and Downloads tabs. Check back fall of 2022 for the first BTOS publication!
Interested in how we derive indexes? Check out the documentation
Weekly Data
| File | File Type | Date Range | Tags |
|---|
General Info and Documentation
Survey Questionnaires
SBPS Questionnaire (02/14/2022 - 04/17/2022)
SBPS Questionnaire (11/15/2021 - 01/16/2022)
SBPS Questionnaire (08/16/2021 - 10/17/2021)
SBPS Questionnaire (05/17/2021 - 07/18/2021)
SBPS Questionnaire (02/15/2021 - 04/18/2021)
SBPS Questionnaire (11/09/2020 - 01/10/2021)
SBPS Questionnaire (08/09/2020 - 10/10/2020)
SBPS Questionnaire (05/17/2020 - 06/27/2020)
SBPS Questionnaire (04/26/2020 - 05/16/2020)
Purpose
The Small Business Pulse Survey (SBPS) measures the effect of changing business conditions during the Coronavirus pandemic on our nation's small businesses. It has also proven valuable in measuring the impact of other major events such as hurricanes on our nation’s small businesses.
SBPS data complements existing U.S. Census Bureau data collections by providing high-frequency, detailed information on the challenges small businesses are facing during the Coronavirus pandemic.
Data is available by sector, state, and for the top 50 MSAs. Survey results give local, state, and federal officials essential real-time data to aid in policy and decision-making. In addition, the information aids businesses in making economic decisions and assists researchers studying the effects of the pandemic.
SBPS results are experimental data products and are subject to suppression based on overall response and disclosure avoidance thresholds. Data products may not meet some of the Census Bureau’s statistical quality standards.
Coverage
The target population is all nonfarm, single-location employer businesses with 1-499 employees and receipts of $1,000 or more in the 50 states, District of Columbia, and Puerto Rico. The sampling frame was extracted from the Business Register in April 2020. The following industries were designated as out of scope for the Business Pulse Survey:
- Agriculture production (NAICS in ('110000', '111', '112'))
- Railroads (NAICS = '482')
- U.S. Postal Service (NAICS = '491')
- Monetary Authorities – Central Bank (NAICS = '521')
- Funds, Trusts, and Other Financial Vehicles (NAICS = '525')
- Religious grant operations and Religious organizations (NAICS = '813')
- Private households (NAICS = '814')
- Public administration (NAICS = '92')
- Unclassified with legal form of organization as tax-exempt or unknown
Content
The Small Business Pulse Survey is being collected in phases in order to provide information on the evolving circumstances in which businesses are operating. Core content found throughout all phases includes overall effect, total revenue, change in revenues, location open/close, change in hours, supply chain delays/difficulties, future needs and expectations. Earlier phases captured request and receipt of financial assistance. In phase 4, COVID19 vaccination and testing questions were introduced. Additional concepts rotated on and off the survey based on the pandemic status. Summary of content shows core content remaining throughout the phases and which content rotated on and off the survey.
Please see questionnaires on the downloads tab.
Frequency
The Small Business Pulse Survey is a weekly survey. Publication schedule is weekly on Thursdays; see the table below for the collection and publication schedules.
| Week | Collection Date | Due Date | Data Published |
|---|
Indexes
Three indexes are constructed for the Small Business Pulse Survey: Overall Sentiment, Operational Challenges, and Expected Recovery. Indexes are used to create a numeric representation of a question or set of questions that have non-numeric answers. See the index documentation for details on how each index is constructed.
- The Overall Sentiment Index (OSI) assesses the overall effect of the pandemic on businesses.
- The Operational Challenges Index (OCI) assesses the overall effect of the pandemic on business operations.
- The Market Challenges Index (MCI) assesses the degree of tightness businesses face in the markets for labor, goods and services purchased by businesses, and the businesses’ own goods. (Phases 6 and 7 only)
- The Financial Stress Index (FSI) assesses the financial difficulties experienced by businesses. (Discontinued in phase 4)
- The Expected Recovery Index (ERI) summarizes the length of the expected recovery of businesses.
For both the OSI and the OCI, negative values up to -1 of the index indicate a negative effect, zero indicates little or no effect, and positive values up to +1 indicate a positive effect.
For the FSI, negative values up to -1 of the index indicate a negative financial impact and zero indicates little or no financial impact. (Discontinued in phase 4)
For the MCI, the index is bound conceptually by [+1, -1] with +1 representing the highest level of tightness and -1 the lowest. (Phases 6 and 7 only)
For the ERI, negative values up to -1 of the index indicate that the business needs time to recover (and an increasing recovery period as the index value approaches -1), while zero indicates little or no recovery period.
Limitations
The Small Business Pulse Survey definition of a small business may not be the same as the definition used by other organizations or federal agencies in order to determine program eligibility. For the Small Business Pulse Survey, the Census Bureau defines a small business as a single location business with employment between 1 and 499 and receipts of at least $1,000. Additionally, for the Small Business Pulse Survey the Census Bureau did not include businesses classified in certain industries that may be eligible for relief programs. Estimates of the share of small businesses applying for or receiving assistance may not equal calculations based on the administrative records of those programs due to these differences or other possible non-sampling error.
The sample for the Small Business Pulse Survey is not a probability sample, although weights were applied to ensure that each weekly panel represented the full population. The target population is all nonfarm, single-location employer businesses 499 or less employees and receipts of $1,000 or more in the 50 states, District of Columbia, and Puerto Rico. The set of businesses in the target population that responded to the 2017 Economic Census was identified as the subset of businesses eligible to participate in the Small Business Pulse Survey. The number of active, in-scope businesses with valid email addresses totaled about 940,500 businesses. Approximately 91,000 email addresses were updated through a match to the databases used for processing monthly and annual economic surveys.
For phase 1, a decision was made during data collection in the first week of the survey to eliminate email addresses linked to three or more businesses from future collections, to eliminate ambiguity in associating survey responses to the correct business. Approximately 885,000 businesses remained in the email sample after this removal. Respondents with email addresses linked to two businesses were instructed to provide a separate report for each of the two businesses. Because there was not a unique matching of e-mail addresses to businesses, some responses may not correspond to the state/industry in which they were tabulated.
For subsequent phases, the company name associated with the sampled EIN was added to the email to clarify the intended recipient. Additionally, the last five digits of the company’s EIN and company name were added to the first page of the electronic instrument.
The Small Business Pulse Survey may be subject to non-response bias, as businesses that have closed due to COVID-19 may not be receiving the invitation to participate and unable to respond. The Small Business Pulse Survey estimates may also be subject to bias if businesses that provide email addresses or that are willing to participate in an email-based survey are systematically different from businesses who do neither. Please see How the Data Are Collected for more information.
Disclosure Statement
Disclosure is the release of data that reveals information or permits deduction of information about a particular survey unit through the release of either tables or microdata. Disclosure avoidance is the process used to protect each survey unit’s identity and data from disclosure. Using disclosure avoidance procedures, the Census Bureau modifies or removes the characteristics that put information at risk of disclosure. Although it may appear that a table shows information about a specific survey unit, the Census Bureau has taken steps to disguise or suppress a unit’s data that may be “at risk” of disclosure while making sure the results are still useful.
The Census Bureau has reviewed the data product for unauthorized disclosure of
confidential information and has approved the disclosure avoidance practices
applied.
(Approval ID: CBDRB-FY20-259, CBDRB-FY20-357 CBDRB-FY21-113, CBDRB-FY21-292)
Contact Us
econ.btos@census.gov
Survey Design
Target Population
The target population is all nonfarm, single-location employer businesses with between 1-499 employees and receipts of $1,000 or more in the 50 states, District of Columbia, and Puerto Rico. The sampling frame was extracted from the final 2018 Business Register in April 2020 and updated with the final 2019 Business Register in December 2020. The following industries were designated as out of scope for the Business Pulse Survey:
- Agriculture production (NAICS in ('110000', '111', '112'))
- Railroads (NAICS = '482')
- U.S. Postal Service (NAICS = '491')
- Monetary Authorities – Central Bank (NAICS = '521')
- Funds, Trusts, and Other Financial Vehicles (NAICS = '525')
- Religious grant operations and Religious organizations (NAICS = '813')
- Private households (NAICS = '814')
- Public administration (NAICS = '92')
- Unclassified with legal form of organization as tax-exempt or unknown
Sampling Frame
The set of businesses in the target population that responded to the 2017 Economic Census was identified as the subset of businesses eligible to participate in the Small Business Pulse Survey (SBPS). The 2017 Economic Census (EC) utilized an all-electronic data collection strategy. Eligible respondents to the Economic Census were mailed a letter containing an authentication code and were invited to create an account using the Respondent Portal. The Respondent Portal provides access to electronic survey instruments. To establish their Respondent Portal account, respondents provided a valid email address, their name, phone number, and were required to establish a password.
Approximately 1.7 million of the over 6 million single-establishment employer businesses received an invitation to respond to the 2017 Economic Census; administrative data were used for the remaining cases to minimize respondent burden. About 1.1 million of the 1.7 million Economic Census cases had between 1 and 499 employees.
In April 2020, the Census Bureau extracted from the final 2018 Business Register single-location businesses with payroll and between 1 and 499 employees. In December 2020, the Census Bureau updated this information using the final 2019 Business Register. The number of active, in-scope businesses with valid email addresses totaled about 940,500 businesses. Approximately 91,000 email addresses were updated through a match to the databases used for processing monthly and annual economic surveys.
In Phase 1 of the Small Business Pulse Survey, a decision was made during data collection in the first week of the survey to eliminate email addresses linked to three or more businesses from future collections, to eliminate ambiguity in associating survey responses to the correct business. Approximately 885,000 businesses remained in the email sample after this removal. Respondents with email addresses linked to two businesses were instructed to provide a separate report for each of the two businesses.
In subsequent phases, email addresses linked to more than 10 businesses remained ineligible for data collection, but all others were retained in the collection. The business name and last five-digits of a selected business’ Employer Identification Number were provided to the respondent in both the survey invitation and upon authenticated entry to the survey instrument in order to clarify the intended respondent to the survey.
Beginning with Phase 6 of the Small Business Pulse Survey, the sampling frame was matched to an extract of the most recent monthly Business Register to identify companies that reported their EIN as inactive on their IRS Form 941 payroll filing. After this update, approximately 834,000 businesses remained in the sample.
Sample Design
To maximize the use of available e-mail addresses, the Census Bureau used the full set of in-scope businesses with e-mail addresses from the Economic Census in the Small Business Pulse Survey. The initial weight for each unit with an e-mail address was set to the count of the total number of units (both with and without email addresses) in the same state by 2-digit NAICS industry divided by the number of units in the same grouping with an e-mail address in the weekly panel.
For Phase 1, the full set of eligible businesses was divided into nine panels for the weekly e-mail invitations to respond to the survey. To establish panels of similar size and industry and geography distributions, the businesses with e-mail addresses were sorted by MSA and 2018 annual payroll within each state by 2-digit NAICS cell and then systematically assigned to one of the nine panels.
Phase 2 - Phase 7 used the same nine panels as Phase 1, with some adjustment to distribute multiple businesses associated with one e-mail address among the panels to maintain sample sizes of roughly equal size in each of the nine collection weeks.
Phase 4 updated the sample using the final 2019 Business Register to include 2019 payroll and employment. Panel assignment remained consistent with previous phases.
Type of Request
The Small Business Pulse Survey is a voluntary survey.
Questionnaire Content
The questionnaire for each phase of the Small Business Pulse Survey contained 21 or fewer questions about the effect of the Coronavirus pandemic on the business, including impacts on operating revenues and availability of cash; closures; changes in the number of paid employees or hours; the re-hiring of laid off or furloughed employees; disruption of supply chains; adoption of different business practices; changes in operating capacity; missed loan and other payments; requests/receipt of financial assistance; capital expenditures, vaccine requirements, and overall well-being and outlook for recovery.
The survey questionnaires and the corresponding instructions are found on the downloads tab.
Mode of Contact
Business respondents were contacted by email to respond to the survey. For each weekly survey panel, emails were delivered on Sunday using staggered times to gauge optimal timing of email delivery on response. For phase 3 and subsequent phases, initial emails were sent on Mondays. The email directed respondents to the https://census.gov/businesspulse landing page that provided information about the survey, FAQs, links to releases of the data products, and a direct link to respond to the survey. Starting in phase 2, the emails directed respondents directly to the reporting instrument. Respondents were provided access to the survey using an authentication code provided in the email. In addition, an email address econ.pulse@census.gov was provided for respondents to send questions about the survey. Responses to questions were provided by Census Bureau Headquarters staff.
A follow-up reminder e-mail was sent on Wednesdays (Friday for the first week) to all non-respondents in the weekly panel. For subsequent phases, starting at the end of phase 2, an additional follow up reminder email was sent on Fridays.
Response Criteria
For phase 1 and phase 2, the response period for each weekly tabulation closes at 11:59pm on Saturdays. For phase 3 and subsequent phases, the response period for each weekly tabulation closes at 11:59pm on Sundays.
To be considered a respondent to the SBPS, a business had to respond to at least one of the survey questions. The online instrument was designed to encourage response to each question. If a survey participant attempted to move past a particular question without providing a response, a warning box appeared to prompt the respondent to provide a response. The participant was permitted to move to the next question without responding on the next attempt.
Responses to each question were tabulated independently. All responses, including those from businesses in prior panels, were included in tabulations for the week in which the responses were provided.
The Unit Response Rate (URR) is calculated weekly as:
Unit response rate = 100 *(R+R’)/(R+NR)
where
- - R is the number of respondents in the currently weekly panel
- - NR is the number of non-respondents in the currently weekly panel
- - R’ is the number of late respondents included in the estimates from any previous panel within each phase
The published values of R and URR are rounded for disclosure protection. See the Disclosure Avoidance section below and Legacy Techniques and Current Research on Disclosure Avoidance for a description of the rounding procedures used for frequency counts and related characteristics.
In Phase 1, only late respondents from the week immediately preceding the current collection week were tabulated as respondents in the current weekly panel. In subsequent phases, late respondents from all collection weeks were included in tabulations.
Compilation of Data
Editing
Due to the nature of the survey questions and rapid cycle of data collection and release, the SBPS response data were not subjected to editing.
Nonresponse
Nonresponse is defined as the inability to obtain requested data from an eligible survey unit. Two types of nonresponse are often distinguished. Unit nonresponse is the inability to obtain any of the substantive measurements about a unit. In most cases of unit nonresponse, the Census Bureau was unable to obtain any information from the survey unit after several attempts to elicit a response. Item nonresponse occurs when a particular question is unanswered.
Nonresponse Adjustment
Adjustment factors were applied to SBPS respondent data to account for unit nonresponse. Within each 2-digit NAICS, nonresponse adjustment factors were calculated for businesses by three employment size classes, to account for potential differential response by business size: four or fewer employees; between 5 and 19 employees; and 20 or more employees. To compute the values of the nonresponse adjustment factor, the sum of the sampling weights of all businesses in the weekly panel was divided by the sum of the sampling weights of all responding businesses in the weekly collection period. The resulting factor was used to adjust the sampling weight for all respondents in the given adjustment cell.
Estimation
For each question on the survey, the published percentage estimate for a particular response category is calculated as the sum of the nonresponse-adjusted weights for all responses in that particular response category, divided by the sum of nonresponse-adjusted weights for each business responding to the question.
In phases 1-3, four indices were calculated from the Small Business Pulse Survey data. These indices summarize the collected data on the following key concepts: overall well-being (Question 1); operations (Questions 2, 4-7); adaptability (Questions 8-9); finances (Questions 10-13); and expected recovery (Question 15). To create the indices, responses for each question are normalized on a [-1, 1] scale. The normalized responses for each business are then averaged over the appropriate set of indexed items. A weighted score for the business was then computed by multiplying the final non-response adjusted weight for the business by the average score. For a given domain (e.g., state, sector, national total), the published index value is the average of the non-response adjusted index values for the responses in the domain.
After phase 3, finance content (Questions 10-13) was dropped, leaving three index calculations.
In phase 6, an index summarizing market tightness (Questions 10, 11, 14, and 15) was calculated. This index was discontinued in phase 8.
Sampling Error
The sampling error of an estimate based on a sample survey is the difference between the estimate and the result that would be obtained from a complete census conducted under the same survey conditions. This error occurs because characteristics differ among sampling units in the population and only a subset of the population is measured in a sample survey. While the particular sample used in this survey was not drawn using traditional probabilistic methods, sampling weights were employed to ensure that the particular sample represented the entire in-scope population. The use of sampling weights also allowed for the estimation of sampling variability of the survey estimates.
A common measure of sampling variability for percentage estimates is the standard error of the estimate. The standard error is the square root of the sampling variance, which is the squared difference, averaged over all possible samples of the same size and design, between the estimator and its average value. The standard errors for the SBPS estimates were calculated using a delete-a-group jackknife procedure, using 10 groups.
It is important to note that the sampling variance and standard error only measure sampling variability. They do not measure any systematic biases in the estimates.
The Census Bureau recommends that individuals using these estimates incorporate sampling error information into their analyses, as this could affect the conclusions drawn from the estimates.
Confidence Interval
The sample estimate and an estimate of its standard error allow us to construct interval estimates with prescribed confidence that the interval includes the average result of all possible samples with the same size and design. To illustrate, if all possible samples were surveyed under essentially the same conditions, and an estimate and its standard error were calculated from each sample, then:
Approximately 68 percent of the intervals from one standard error below the estimate to one standard error above the estimate would include the average estimate derived from all possible samples.
Approximately 90 percent of the intervals from 1.645 standard errors below the estimate to 1.645 standard errors above the estimate would include the average estimate derived from all possible samples.
In the example above, the margin of error (MOE) associated with the 90 percent confidence interval is the product of 1.645 and the estimated standard error.
For example, suppose that a domain had an estimated percentage of 50% (.50) in one response category and that the standard error of this estimate was 0.005. A 68 percent confidence interval for this estimate is 0.495 to 0.505, and a 90-percent confidence interval is 0.492 to 0.508 (0.500 plus or minus 1.645 times 0.005).
Nonsampling Error
Nonsampling error encompasses all factors other than sampling error that contribute to the total error associated with an estimate. This error may also be present in censuses and other nonsurvey programs. Nonsampling error arises from many sources: inability to obtain information on all units in the sample; response errors; differences in the interpretation of the questions; mismatches between sampling units and reporting units, requested data and data available or accessible in respondents’ records, or with regard to reference periods; mistakes in coding or keying the data obtained; and other errors of collection, response, coverage, and processing.
Although no direct measurement of nonsampling error was obtained, precautionary steps were taken in the collection, processing, and tabulation of the data in an effort to minimize its influence. Precise estimation of the magnitude of nonsampling errors would require special experiments or access to independent data and, consequently, the magnitudes are often unavailable.
The Census Bureau recommends that individuals using these estimates factor in this information when assessing their analyses of these data, as nonsampling error could affect the conclusions drawn from the estimates.
Refer to the response criteria section above for how unit response rate (URR) was calculated for each weekly panel of the SBPS as an indicator of potential nonsampling error. Businesses were assumed to be active and in-scope in the absence of evidence otherwise. This included unsuccessful delivery of emails to some cases.
Disclosure avoidance
Disclosure is the release of data that reveals information or permits deduction of information about a particular survey unit through the release of either tables or microdata. Disclosure avoidance is the process used to protect each survey unit’s identity and data from disclosure. Using disclosure avoidance procedures, the Census Bureau modifies or removes the characteristics that put information at risk of disclosure. Although it may appear that a table shows information about a specific survey unit, the Census Bureau has taken steps to disguise or suppress a unit’s data that may be “at risk” of disclosure while making sure the results are still useful.
The Census Bureau has reviewed the data product for unauthorized disclosure of confidential information and has approved the disclosure avoidance practices applied. (Approval ID: CBDRB-FY20-259, CBDRB-FY20-357, CBDRB-FY21-113, CBDRB-FY21-292)
Papers
Small Business Pulse Survey Phases 5 through 8 Nonresponse Bias and Coverage Bias Analysis Report
View paper hereSmall Business Pulse Survey Phases 1 through 4 Nonresponse Bias and Coverage Bias Analysis Report
View paper hereHigh‑frequency data from the U.S. Census Bureau during the COVID‑19 pandemic: small vs. new businesses
View paper hereMeasuring the Impact of COVID-19 on Businesses and People: Lessons from the Census Bureau's Experience
View paper hereHigh Frequency Business Dynamics in the United States During the COVID-19 Pandemic
Measuring the Effect of COVID-19 on U.S. Small Businesses: The Small Business Pulse Survey
View paper hereResearch Data Products
Research data products include SBPS estimates at the national level by the rural or urban location of the business and by the sex, race, ethnicity, and veteran status of the business ownership. Research data products may not meet all Census Bureau quality standards.
Like the SBPS, these estimates have a target population that includes all non-farm single location employer businesses with 1-499 employees; for more information on the SBPS target population see How the Data are Collected. Ownership estimates are the result of matching SBPS responses to the Annual Business Survey; users of these estimates are encouraged to read the associated paper to understand their limitations.
See the User Guide for Published Research Estimates for information on how to determine if differences between estimates are statistically significant.
SBPS research data products are currently available for the first three phases of the survey covering the following periods:
- Phase 1 April 26 to June 27, 2020
- Phase 2 August 9 to October 12, 2020
- Phase 3 November 9, 2020 to January 10, 2021
Microdata for the Small Business Pulse Survey as well as underlying data used to construct the research data products are available to qualified researchers on approved projects in the Federal Statistical Research Data Center network.
| File | Description |
|---|---|
| User Guide SBPS research products | User Guide |
Please note SBPS estimates by ownership characteristics file was revised on September 8, 2021. Please disregard previous versions.
DRB Approval: CBDRB-FY21-026, CBDRB-FY21-073, CBDRB-FY21-291, and CBDRB-FY21-ESMD006-013
What is the Small Business Pulse Survey?
The U.S. Census Bureau launched the Small Business Pulse Survey (SBPS) in April 2020, to measure the changes in business conditions on our nation's small businesses during the Coronavirus (COVID-19) pandemic. Since April 2020, there have been seven phases of the SBPS.
The SBPS is authorized by OMB number, 0607-1014.
Why is the Small Business Pulse Survey conducted?
The U.S. Census Bureau recognizes the need for accurate, near real-time data on the U.S. population and economy. This survey helps us to understand how small businesses are weathering the Coronavirus pandemic.
What data are collected in the Small Business Pulse Survey?
The Small Business Pulse Survey is being conducted in phases, and some content differs between the phases. Please see questionnaires on the downloads tab.
How is the data collected for the Small Business Pulse Survey?
The Small Business Pulse Survey goes out to a different sample of respondents via e-mail each week. Data collection occurs using our online reporting instrument. For more information, please see how the data are collected tab.
Is more detailed data available, such as micro data?
Unfortunately, the design of the Small Business Pulse Survey did not include detail beyond what has been published. The products that we release are subject to disclosure avoidance procedures, and the ability to provide a micro dataset, even anonymized, could show individual responses across questions.
Whom can I contact with a specific question about the data?
Please refer to our Visualization Guide for help using the data tool.
For any additional questions, please email your inquiries to econ.btos@census.gov
What is the size of the Small Business Pulse Survey sample?
The Census Bureau invites over 90,000 businesses to respond each week, reaching nearly one million small businesses across a 9-week rotation to reduce burden and lessen survey fatigue.
How does the Census Bureau define a small business?
For the purpose of this survey, the U.S. Census Bureau defines a small business as a single location business with between 1-499 employees and at least $1,000 in annual revenue.
How are the Small Business Pulse Survey data used?
The data produced will consist of national estimates as well as state, top 50 metro, and industry detail. These series will be particularly useful to small businesses making decisions about their future, policymakers as they seek to address challenges faced by these businesses, and researchers studying the impact and response to COVID-19.
What steps does the Census Bureau undertake to ensure that confidential data are secure?
Federal law requires the U.S Census Bureau to keep information collected confidential and to use responses only to produce official statistics. Census has strict measures in place to protect respondents' privacy as well as the identities of all businesses, organizations, and institutions.
econ.btos@census.gov